Forecast
This report was designed to give a forecast based on your LOS data for your company. The goal was to give report consumers options on how the forecast is calculated, providing options for number of historical years used in the forecasting and a variable growth factor from -5 to 10 percent.
Dataset
Before opening the template, please ensure that you have prepared either an Excel worksheet, a Microsoft SQL (MSSQL) Custom View, or a PostgreSQL Custom View to serve as the dataset, depending on the template you intend to use. Verify that the fields are named precisely as listed in the 'Field Name' column below. If Excel is your dataset, confirm that the sheet containing the relevant data is named Data.
Field Information
All these fields must be part of the dataset, if one of the fields listed is not something that is currently in your LOS then it is alright to use the same data point for the column. Example, if you don't have a field for your Branch name, then it would be ok to use a field like Branch Cost Center as the Branch data.
| Field Name | Field Description |
|---|---|
| Application Date | The date that a loan is considered an application |
| Branch | Field used for the name of the Branch |
| File Started Date | The date that the loan file was started |
| GUID | Unique identifier on a per loan bases |
| Loan Purpose | The purpose of the loan such as Purchase, Refi, etc... |
| Loan Type | The type of loan such as Conventional, FHA, etc... |
| Lock Date | The date that the loan was locked |
| Total Loan Amount | The full loan amount |
| Funding Date | The date the loan was funded |
These are the only required fields for the template to work correctly. If you want to expand your report to include other data points then you can add those fields in as long as they are not named the same as one of the columns above.
Note
This dataset uses many of the same filed as the other templates. It is possible to point the other templates at the same dataset to minimize the number of reports that need to be exported out of the LOS.
Using the template
Using Excel as a data source
Once you have your Excel file ready to go with the correct column headers and sheet name open the template_forecast.pbit and you will be prompted for the file path to your Excel file. This file path must be the exact full path to the file. Example is if I have my Excel file saved to my desktop as LOS_Data.xlsx then the path I would type in is C:\Users\Jody\Desktop\LOS_Data.xlsx

Once the file path is typed in click load, your data will be imported and the report will open. From here you can customize the report by swapping out fields in visuals or possible changing measures or custom fields to better suit your companies work flow.
Using Microsoft SQL as a data source
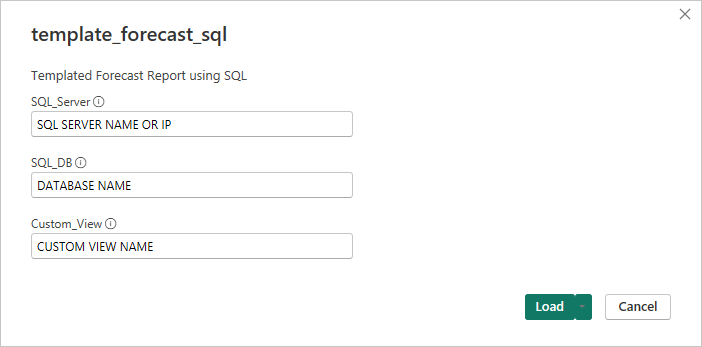
Once you have your MSSQL custom view built out with the correct column names, open the template_forecast_sql.pbit and you will be prompted for 3 pieces of information:
- SQL_Server: This can be the IP address or name of the SQL server that the database that house your data resides.
- SQL_DB: This is the name of the database that holds the custom view we are wanting to use for the template.
- Custom_View: This is the name of the custom view that contains the columns needed for the template.

Note
If you need to add a port number to the end of your SQL server address simply add a colon to the end followed by the port number, example MY-SQL-SERVER:1234.
Once this information is loaded, you may be prompted for a username and password for the SQL server, please work with your server admin to get the correct credentials. Once everything is connected up the report will open allowing you to customize the report to your companies needs.
Using a PostgreSQL dataset
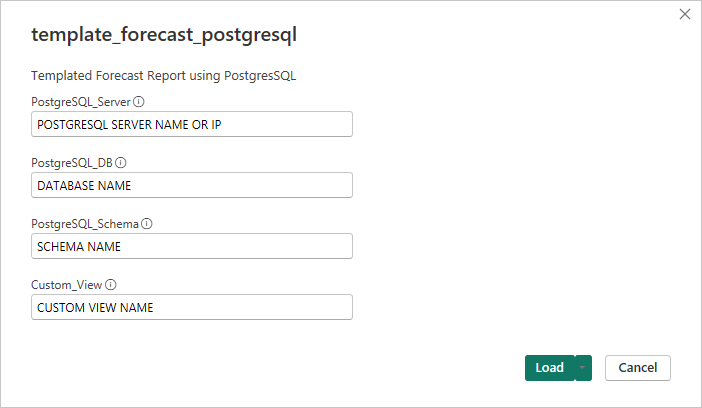
Once you have your PostgreSQL custom view built out with the correct column names, open the template_forecast_postgresql.pbit and you will be prompted for 4 pieces of information:
- PostgreSQL_Server: This will be the IP address or name of the PostgreSQL server that houses the database with your LOS data.
- PostgreSQL_DB: This is the name the database that holds the schema and data we will be using for the template.
- PostgesSQL_Schema: This is the name of the Schema that holds the custom views and data that will be used for the tempalte.
- Custom_View: This is the name of the custom view that contains the data needed for the template.

Note
If you need to add a port number to the end of your PostgreSQL server address, simply add a colon to the end of your server IP or name followed by the port number, example would be: MY-POSTGRESQL-SERVER:1234, where :1234 is the port number.
Once this information is loaded, you may be prompted for a user name and password for the PostgreSQL server, please work with your server administrator to get the correct credentials. Once everything is connected up the report will open allowing you to customize the report to your companies needs.
Report Pages
Pages on this report are intended to provide forecast based on previous years of data from your LOS platform. Each report page contains the same visuals and slicers to filter the data. As such we initial focus on the following areas for forecast but feel free to add more or remove pages that do not match your companies needs:
- File Started
- Applications
- Locks
- Funded
Since each page contains the same visuals lets take a closer look at each one and see what information it provides or how it interacts with the report.
Slicers
Year
The Year slicer provides the current year and the next year as selections. This slicer uses the Year column from the Dates table as its source while having the Date Range - Filter column applied as the filter for this visual. The Date Range - Filter will make sure that the 2 years (current and next year) are always shown.
Note
If you have next year chosen but only choose 1 year in the Historical Years slicer, you will only have a forecast up to the current month. This is expected as we are only looking 1 year back for historical data to use and have not gotten past the past the current month in the current year which would be one year back from next year.
Units/Volume
Like many of the report templates found on this site the Units/Volume slicer allows you to toggle between viewing the data in total loans (Units) or the total loan amount (Volume). Choosing one of those options will update the visuals to show the corresponding data, as well as updating titles to match.
Loan Type
Allows you to focus the report down to the different loan types that may be in your system.
Loan Purpose
Like Loan Type this slicer allows for a focus look at loan purpose that may be available in your system.
Growth Factor
This slicer impacts the forecast measure directly. The way we calculate the forecast is to get the average for the loan data based on the years selected and then multiply that by the growth factor selected. This allows us to quickly adjust our forecast based on how the year is going or allow report consumers to do multiple forecast across many different growth scenarios without the need to edit the underlying DAX.
Historical Years
This slicer also impacts the forecast measure directly. We use this number to know how many previous years to average for the forecast measure.
Branch
Allows a focus on the forecast for a particular Branch or multiple branches can be selected to make up an Area/Region.
Note
When choosing branches, if a branch does not have a full set of historical data based on the number of years chosen then only those months that have historical data will show a value.
Totals
This visual shows the total units or volume, depending on what is selected, based on the current filters on the left side of the page. By default this shows the full years total but clicking or control clicking on the months on the line graph these totals can be filtered further down. This is helpful to narrow down the totals to a selected month or quarter of the year.
The Current total shows all loans for the selected page up to the last sync time of the data. While the Forecast total show the forecasted total for the selected page based on the growth factor and historical years chosen.
Line Graph
The line graph section of the report actually is composed of 3 main visuals, a line graph to display both the Forecast and Current data based on the filters chosen and then two slicers to change how the data is represented on the line graph.
The Show As slicer provides a way to change how the totals are displayed. When Cumulative is selected then the line graph will show a Year to Date representation of the data, allowing us to see how the year should progress. When Monthly is chosen the line graph will change into a more month over month representation, allowing for a look at how the current year is stacking up against the forecast.
The Historical Data slicer give a way to show or hide the forecast for months that have passed. When Historical Data is hidden then we display the current (actuals) for the months that we have full data for, example being if we are in October, I will only show current up to September. This is because we don't know what the current totals are going to end at for the current month and we only show the forecast for the months that we do not have full currents for. When we show Historical Data we are actually showing the forecast for all months along with the currents for those months. With this selection the currents for the current month are shown as we know that that is and compare it to the forecast for this month.
Note
When choosing to show the Cumulative data with the Historical Data shown the current data will plateau out in the current month. This is to be expected as we only have data up to the current month and the rest of the year has not happened yet.
Download
- Download Template - Excel Data Source
- Download Template - SQL Data Source
- Download Template - PostgreSQL Data Source