Pull-Through
This report was designed to give insight into the pull-through rates of loans for your company. My hope is that this report will act as a starting point to build out a Pull-Through report that works best for your companies work flow.
Dataset
Before opening the template, please ensure that you have prepared either an Excel worksheet, a Microsoft SQL (MSSQL) Custom View, or a PostgreSQL Custom View to serve as the dataset, depending on the template you intend to use. Verify that the fields are named precisely as listed in the 'Field Name' column below. If Excel is your dataset, confirm that the sheet containing the relevant data is named Data.
Field Information
All these fields must be part of the dataset, if one of the fields listed is not something that is currently in your LOS then it is alright to use the same data point for the column. Example, if you don't have a field for your Branch name, then it would be ok to reuse the same field this is used for ORGID as the Branch data.
| Field Name | Field Description |
|---|---|
| ORGID | Field used to group loans based on branch number or Cost Center |
| Branch | Field used for the name of the Branch |
| GUID | Unique identifier on a per loan bases |
| Funding Date | The date the loan was funded |
| Application Date | The date that a loan is considered an application |
| Decisioned Date | The date that the loan was decisioned |
| File Started Date | The date that the loan file was started |
| Lock Date | The date that the loan was locked |
| Clear To Close | The date the loan was clear to close |
| Sent to Processing | The date the loan was sent to processing |
| Submitted to Underwriting | The date the loan was submitted to underwriting |
| Purchase Date | The date teh loan was purchased |
| Loan Purpose | The purpose of the loan such as Purchase, Refi, etc... |
| Loan Type | The type of loan such as Conventional, FHA, etc... |
| Loan Officer | Loan Officer's name |
These are the only required fields for the template to work correctly. If you want to expand your report to include other data points then you can add those fields in as long as they are not named the same as one of the columns above.
Note
This dataset uses many of the same filed as the other templates. It is possible to point the other templates at the same dataset to minimize the number of reports that need to be exported out of the LOS.
Using a template
Using a Excel dataset
Once you have your Excel file ready to go with the correct column headers and sheet name open the template_scorecards.pbit and you will be prompted for the file path to your Excel file. This file path must be the exact full path to the file. Example is if I have my Excel file saved to my desktop as LOS_Data.xlsx then the path I would type in is C:\Users\Jody\Desktop\LOS_Data.xlsx

Once the file path is typed in click load, your data will be imported and the report will open. From here you can customize the report by swapping out fields in visuals or possible changing measures or custom fields to better suit your companies work flow.
Using a Microsoft SQL dataset
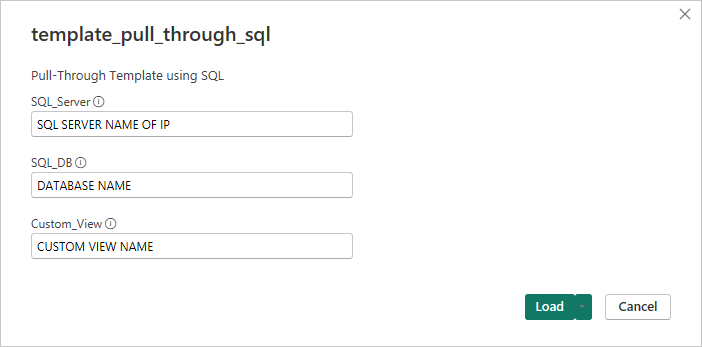
Once you have your MSSQL custom view built out with the correct column names, open the template_pull_through_sql.pbit and you will be prompted for 3 pieces of information:
- SQL_Server: This will be the IP address or name of the SQL server that houses the database with your LOS data.
- SQL_DB: This is the name the database that holds the custom view we will be using for the template.
- Custom_View: This is the name of the custom view that contains the data needed for the template.

Note
If you need to add a port number to the end of your SQL server address, simply add a colon to the end of your server IP or name followed by the port number, example would be: MY-SQL-SERVER:1234, where :1234 is the port number.
Once this information is loaded, you may be prompted for a user name and password for the SQL server, please work with your SQL server administrator to get the correct credentials. Once everything is connected up the report will open allowing you to customize the report to your companies needs.
Using a PostgreSQL dataset
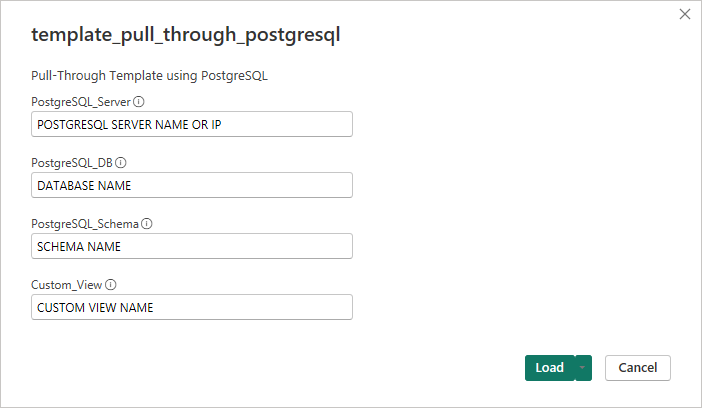
Once you have your PostgreSQL custom view built out with the correct column names, open the template_pull_through_postgresql.pbit and you will be prompted for 4 pieces of information:
- PostgreSQL_Server: This will be the IP address or name of the PostgreSQL server that houses the database with your LOS data.
- PostgreSQL_DB: This is the name the database that holds the schema and data we will be using for the template.
- PostgesSQL_Schema: This is the name of the Schema that holds the custom views and data that will be used for the tempalte.
- Custom_View: This is the name of the custom view that contains the data needed for the template.

Note
If you need to add a port number to the end of your PostgreSQL server address, simply add a colon to the end of your server IP or name followed by the port number, example would be: MY-POSTGRESQL-SERVER:1234, where :1234 is the port number.
Once this information is loaded, you may be prompted for a user name and password for the PostgreSQL server, please work with your server administrator to get the correct credentials. Once everything is connected up the report will open allowing you to customize the report to your companies needs.
Report Pages
Pages on this report are intended to provide insight into branch and users pull-through performance. Pages in this report contain measures that provide insight into percentages of funded loans and average number of days between milestones.
Pull-Through
This page provides information for pull-through percentages for funded loans and the average days for milestones. The card visuals in each section show the company pull-through or average days. The tables in each section contain the branch pull-through or average days for comparison to for the company. Clicking on one of the branches will make the Branch Details button appear Pull-Through Percentages header allowing you to drill down to Branch Details page. The Loan Purpose and Loan Type visuals at the bottom allow for further filtering as you can click on one of the data points and the rest of the report will show the pull-through percentages and average days for the selected data point.
Branch Details
This page provides the same information as the Pull-Through page but it is drilled down to the branch level. The tables now display loan officer information for comparison to how the branch is doing. The arrow in the Pull-Through Percentages will return you to the Pull-Through page.
Customization Options
Default Date Range
By default all report pages have a filter applied to only show dates in the last five years. A custom column in the Dates table with the name of Date Range - Pull Through is used for this filter. By changing the DAX in this field you can narrow or expand the that date range.
Info
Most the time when updating a columns name in Power BI, visuals and filters that use that column will automatically update. If for some reason it doesn't simple remove the old column from the Filters pane and replace with your new column.
Download
- Download Template - Excel Data Source
- Download Template - MSSQL Data Source
- Download Template - PostgreSQL Data Source